 Docs
Docs
Operational Intelligence
The Kinvey Operational Intelligence feature provides a way for single tenant users to visualize and analyze backend logs using a dedicated Elasticsearch and Kibana. The Kinvey backend logs consist of events such as incoming requests, responses, authentication information, as well as logs from other services like Flex, Business Logic and RapidData.
Requirements
- A dedicated Kinvey instance. Only owners of dedicated instances can request setup of Operational Intelligence.
Operation Intelligence Access
Navigate to your dedicated Kibana instance and log in.
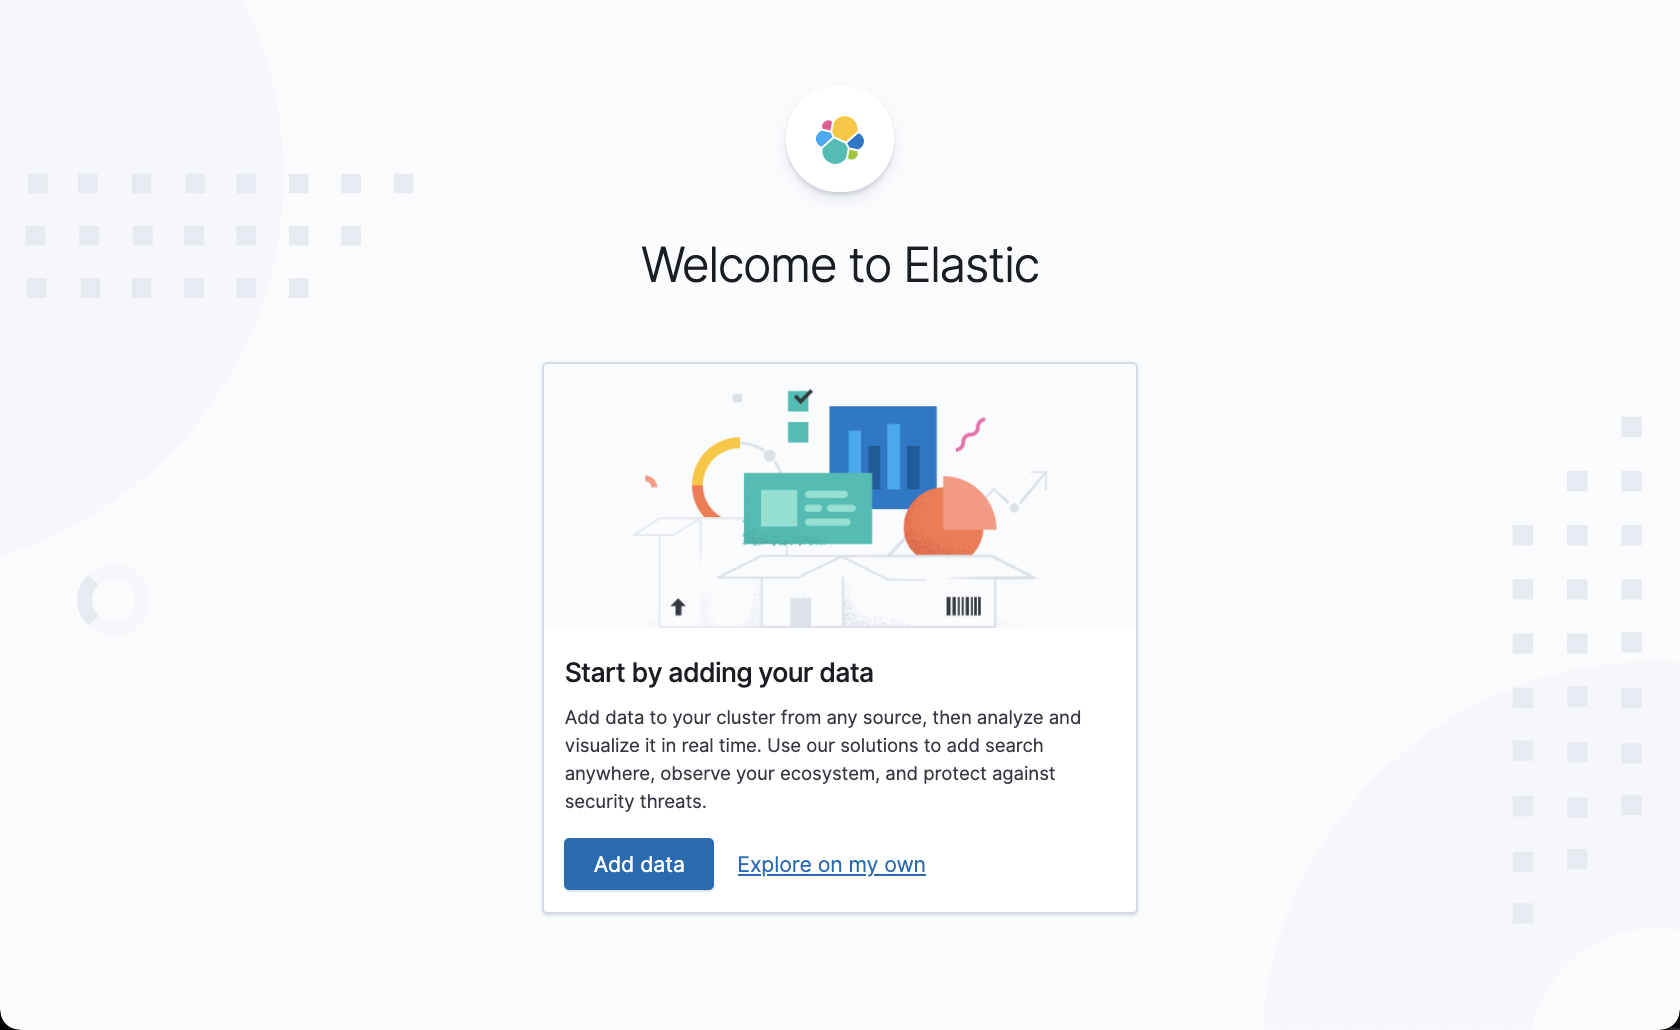
Skip the welcome screen by pressing "Explore on my own".
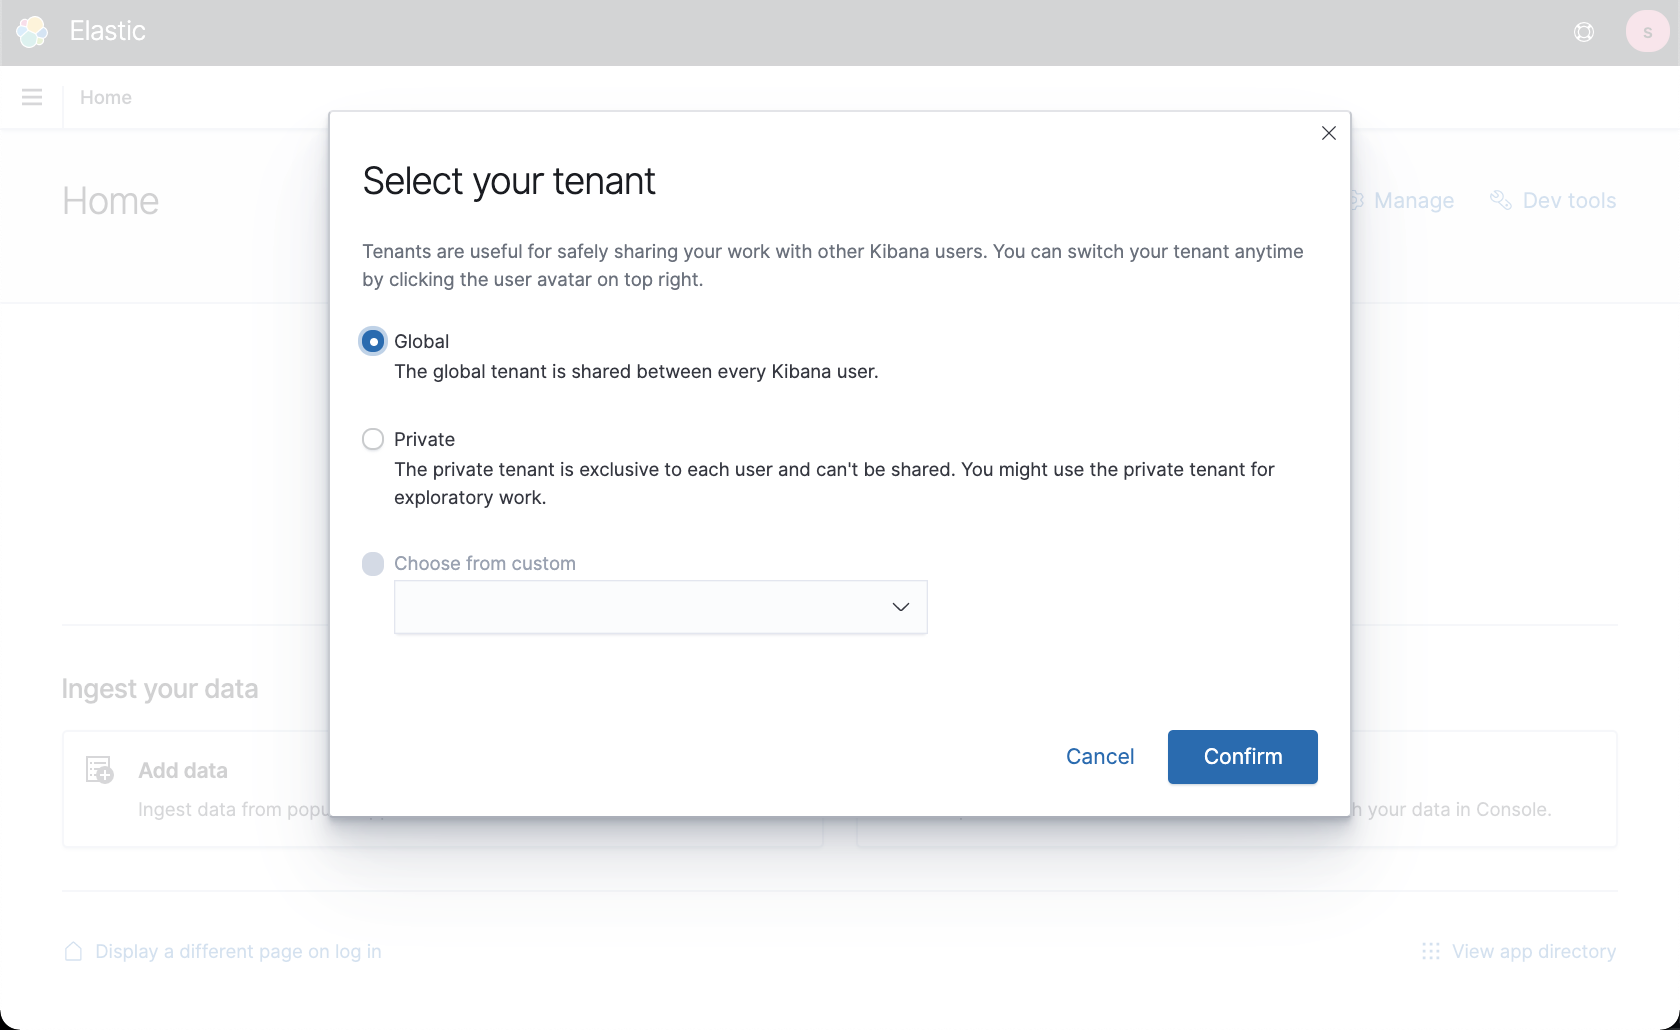
Select the "Global" tenant.
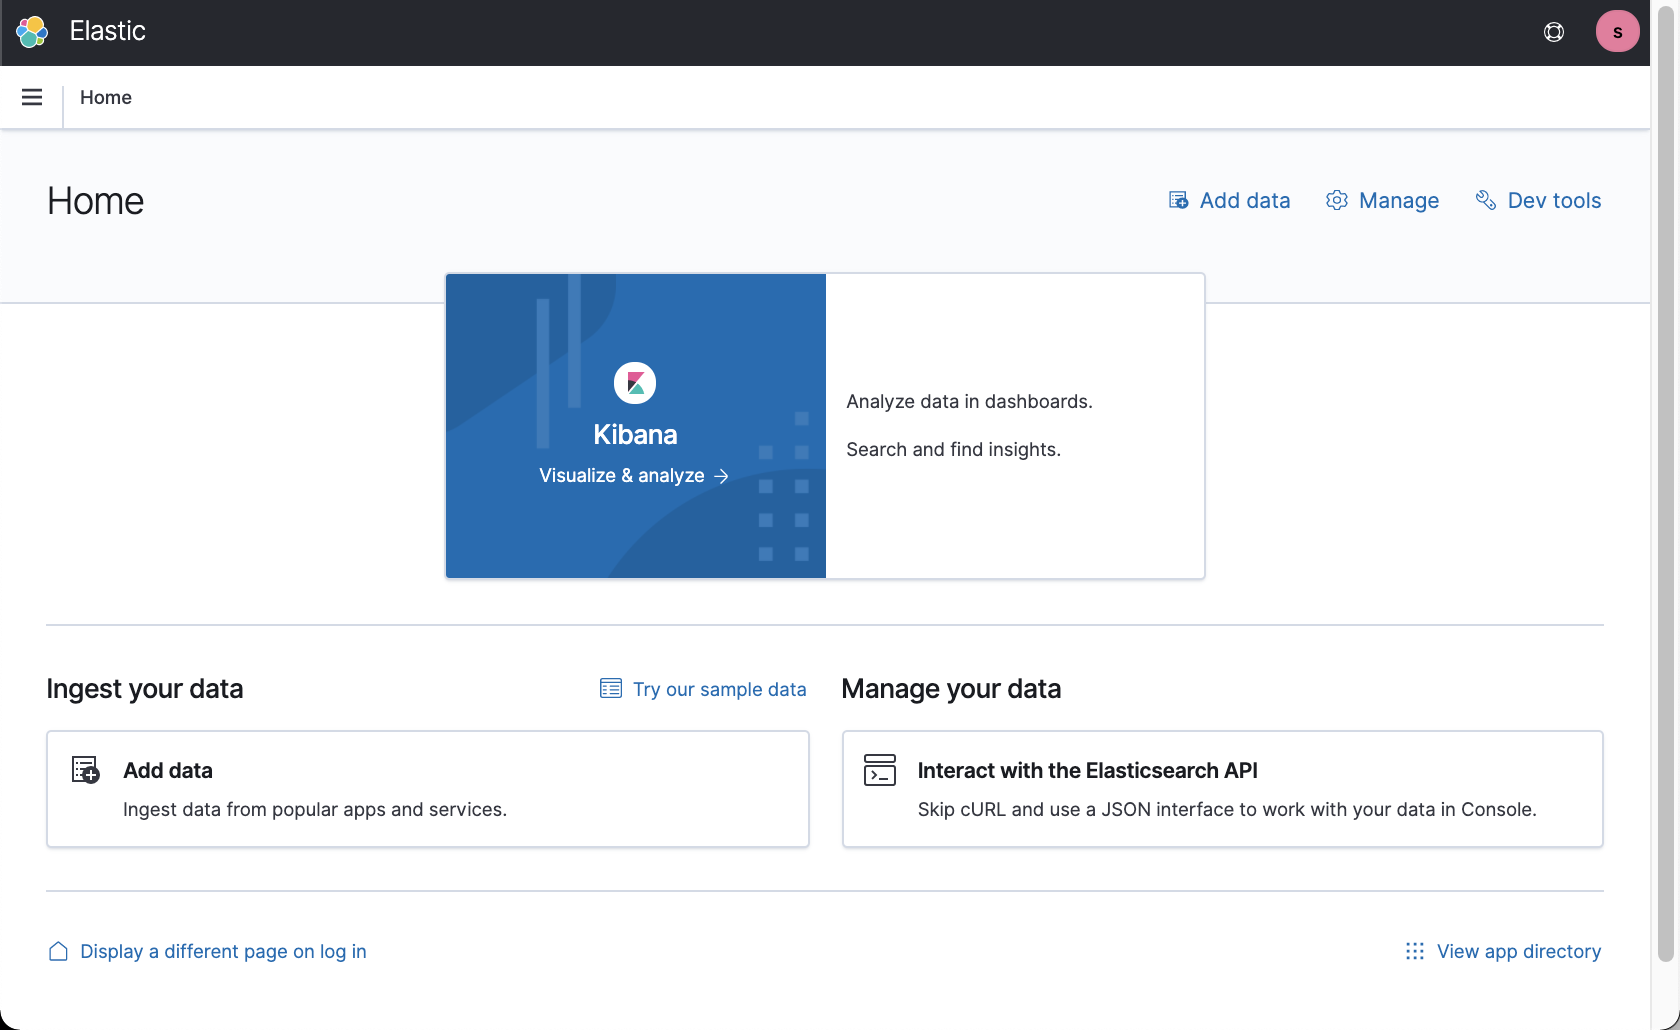
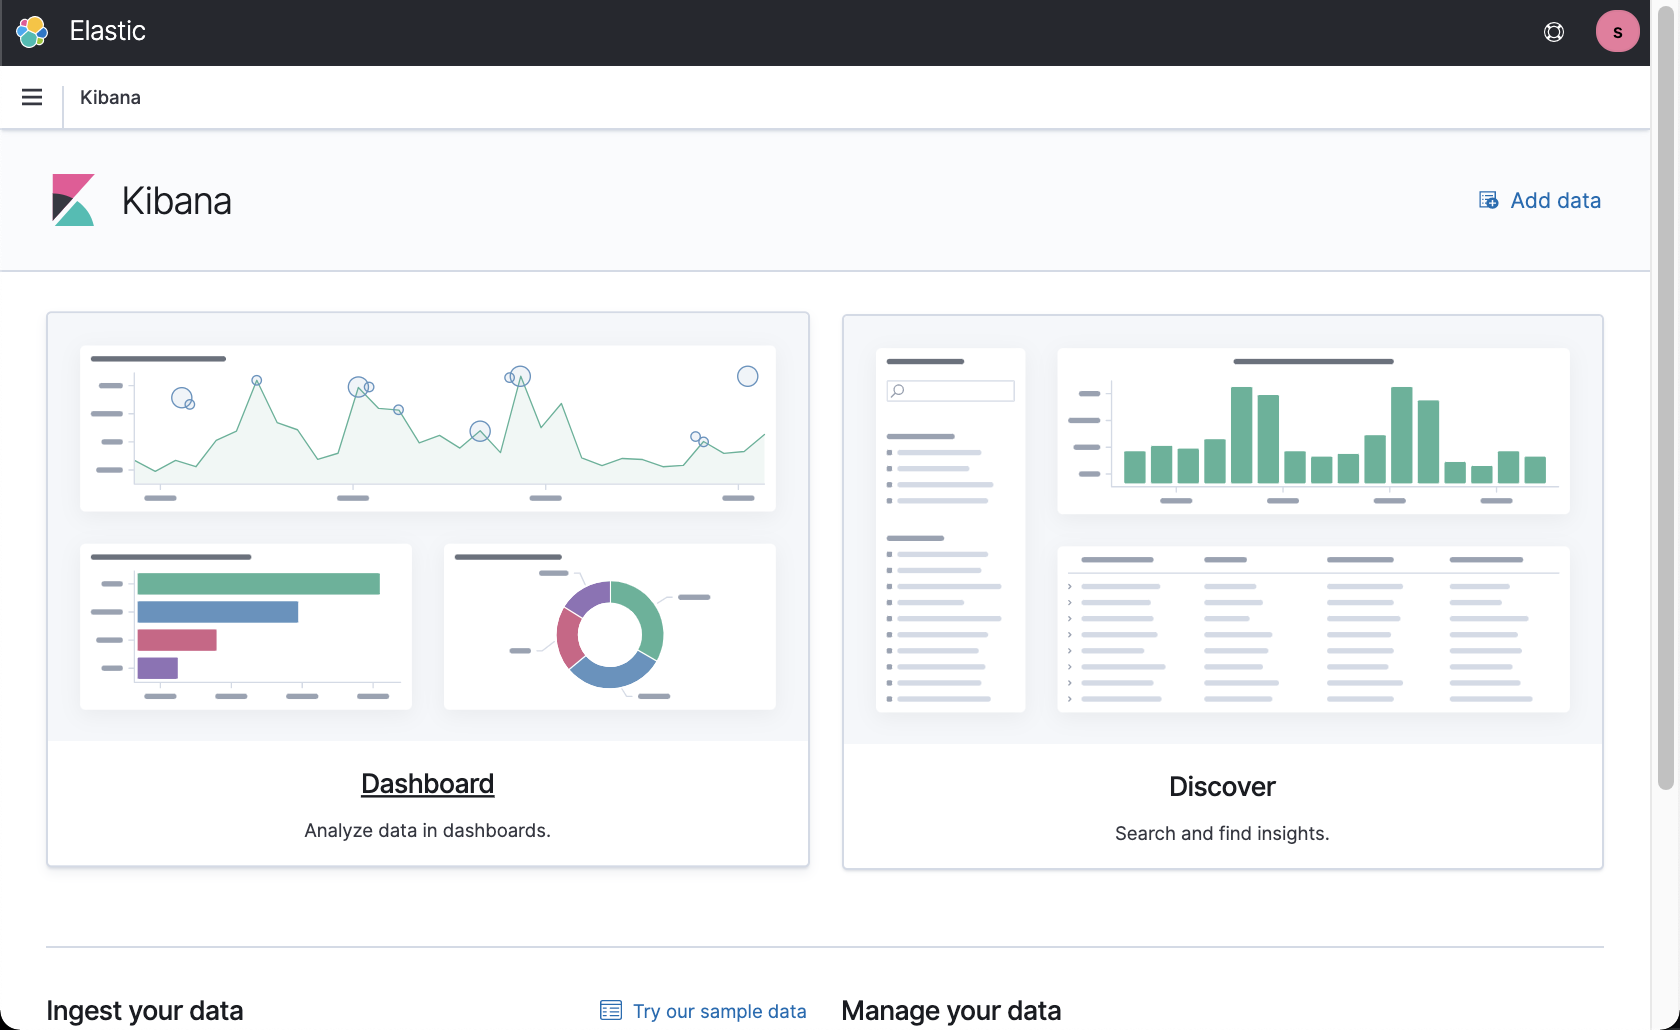
From the Home screen go to "Visualize & analyze"
From here you can go to the list of dashboards
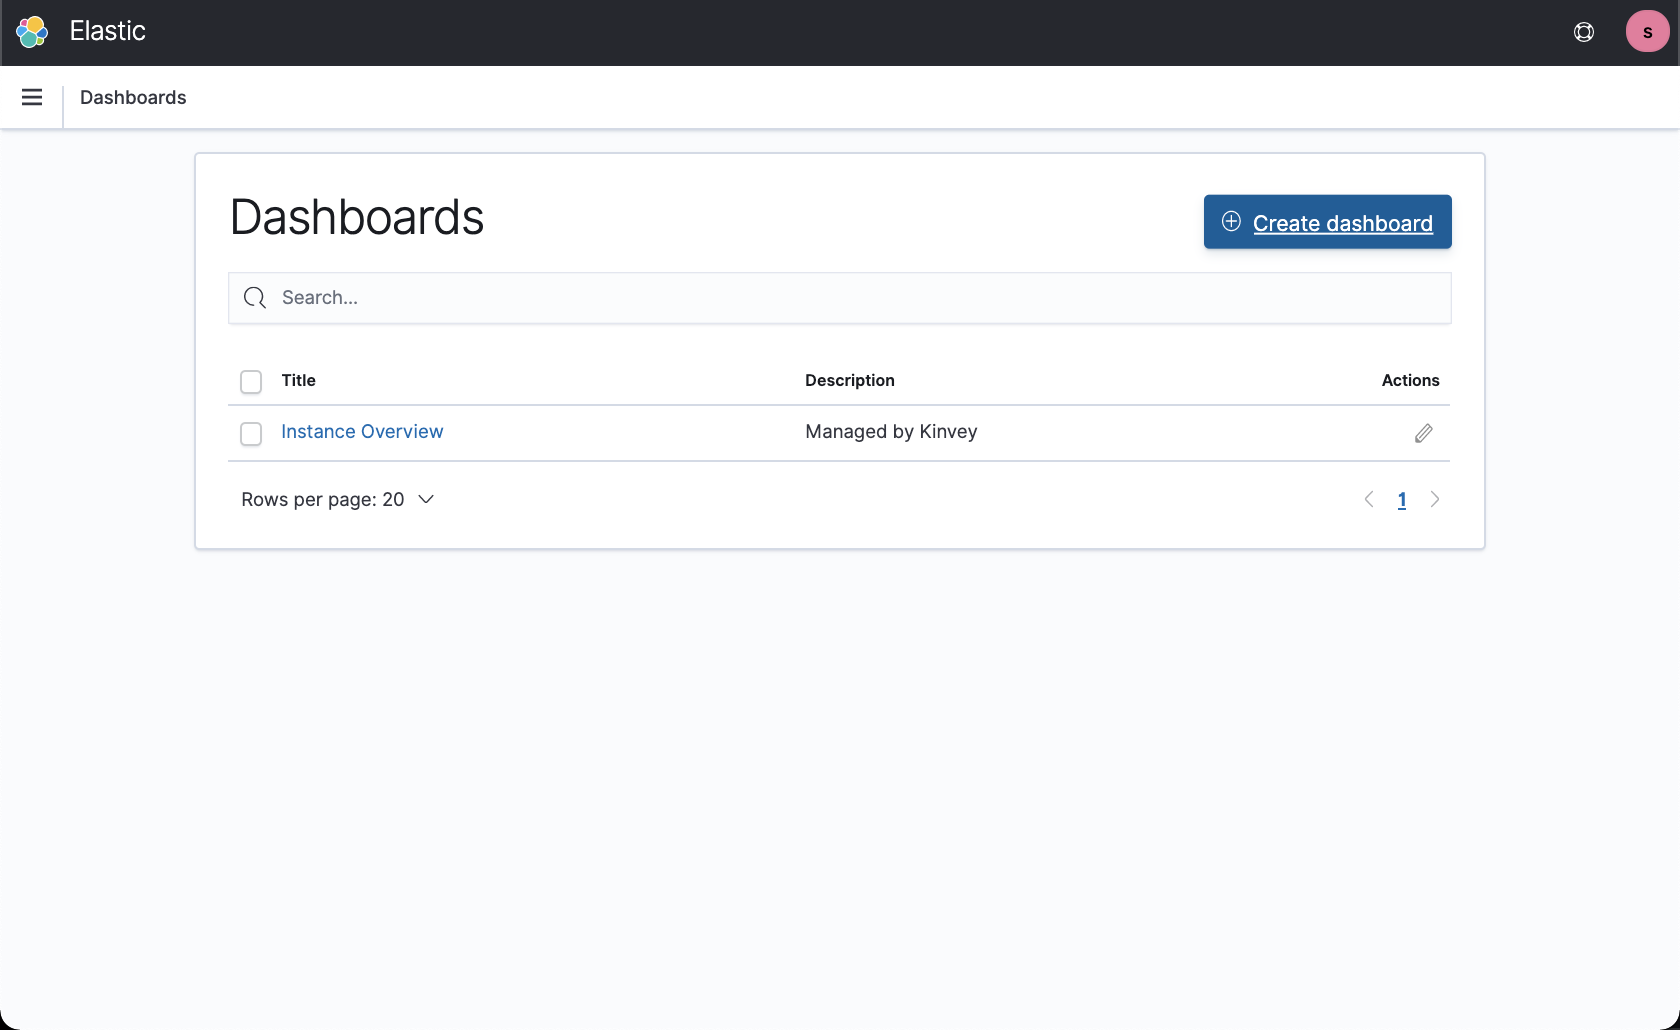
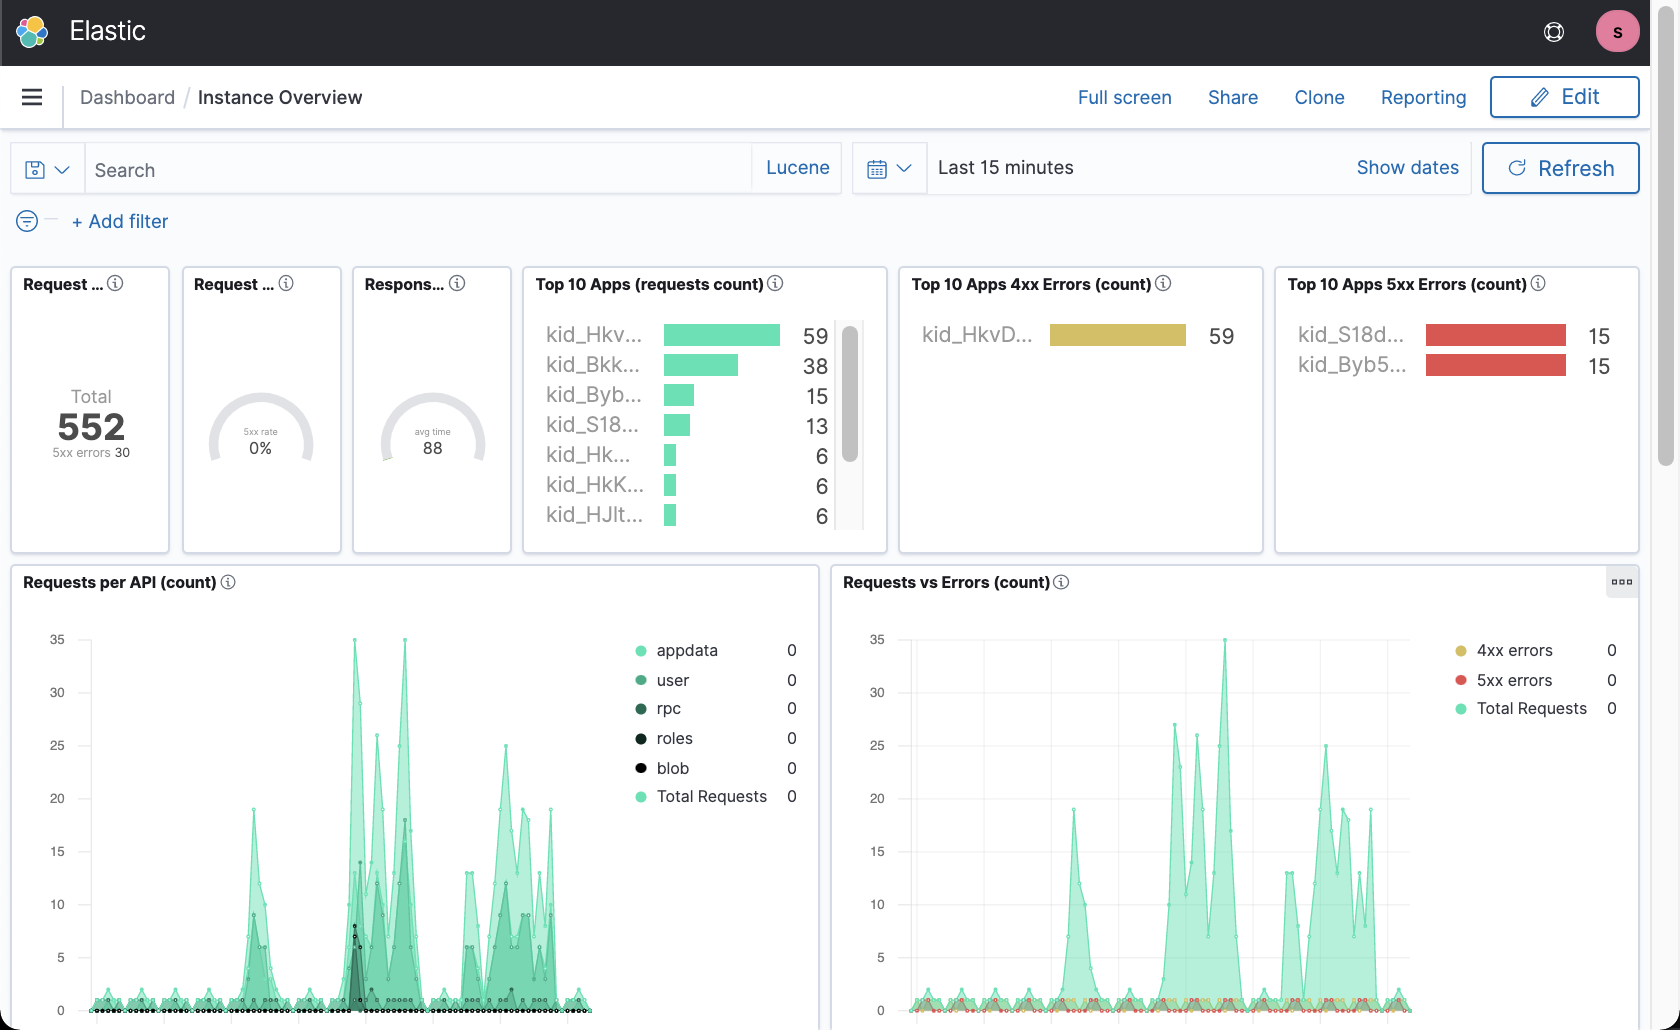
And see the predefined "Instance Overview" dashboard
Additionaly from the side navigation menu you can go to "Discover" for a raw view of the log events
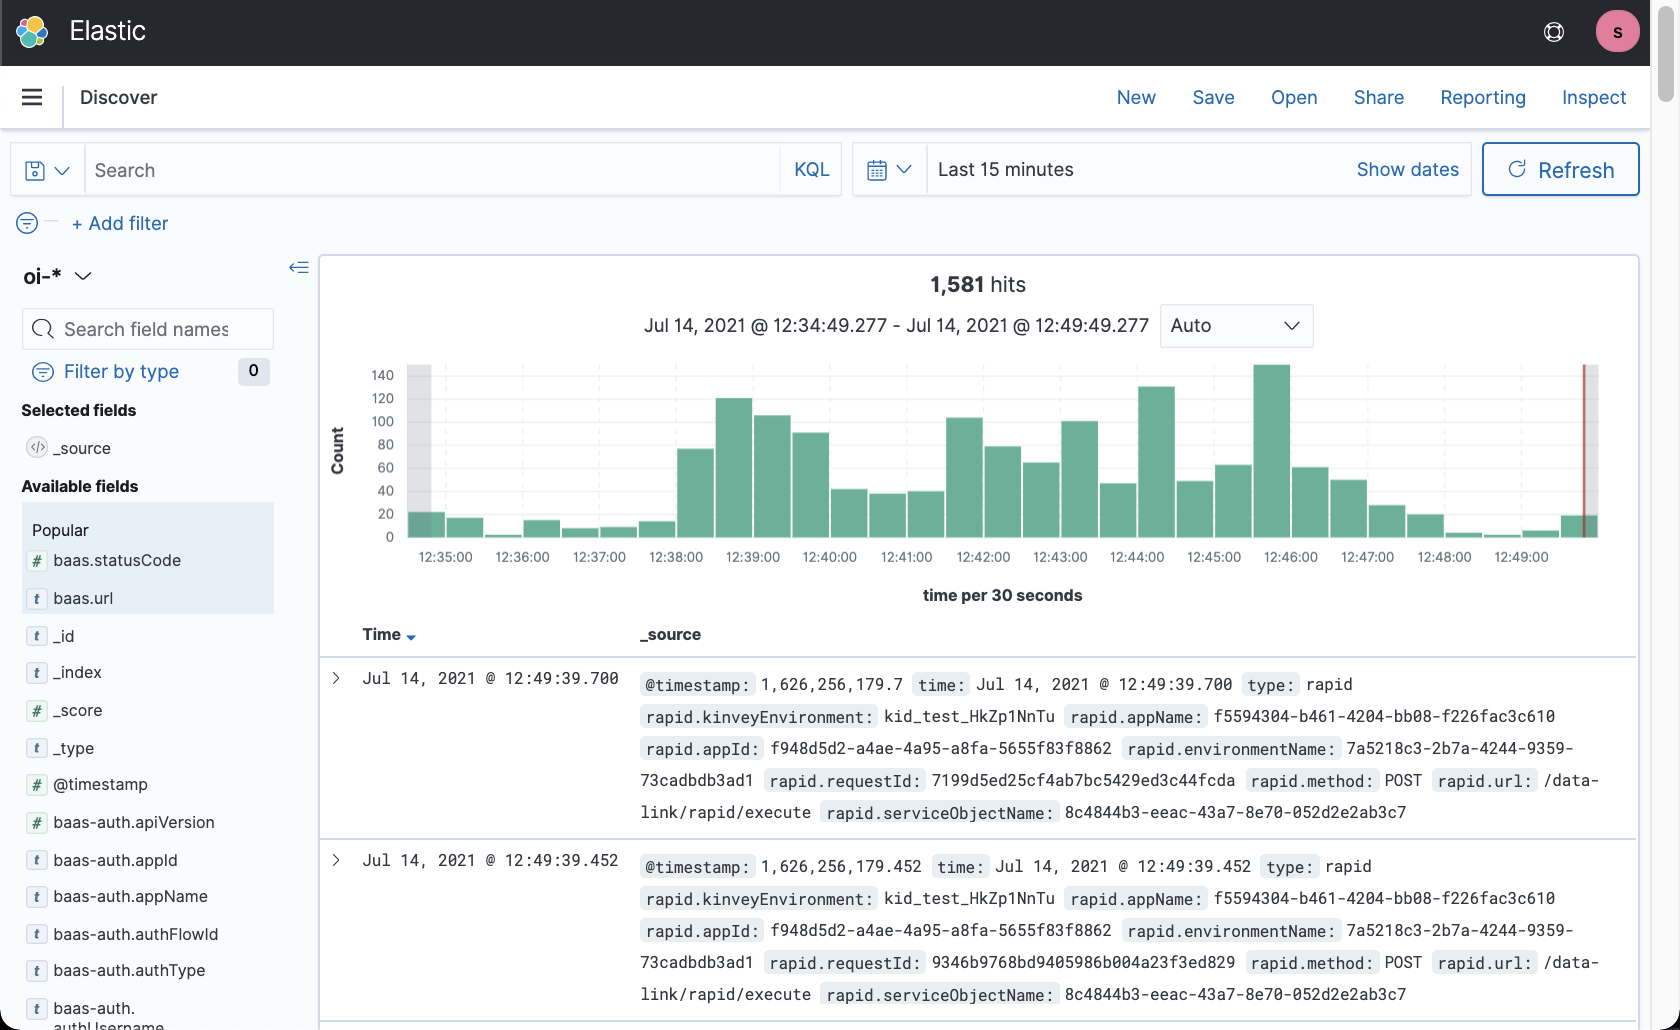
baasfor request made from clients to Kinvey.baas-authfor MIC logs.blfor logs of execution of Business Logic.bl-runtimefor logs from the Business Logic scripts.flexfor logs of execution of internal Flex services.flex-runtimefor logs from the internal Flex services.flex-buildfor logs from the building the internal Flex services.rapidfor logs between RAPID and the system of record.
Custom visualizations and dashboards
The feature uses Elasticsearch and Kibana. For more information on how to create custom visualizations and dashboards check the official documentation: https://www.elastic.co/guide/en/kibana/7.13/dashboard.html