 Docs
Docs
Log Analytics
The Kinvey Log Analytics feature provides a way for single tenant users to stream backend logs to external systems. The Kinvey backend logs consist of events such as incoming requests, responses, authentication information, as well as logs from other services like Flex, Business Logic and RapidData.
Requirements
- A dedicated Kinvey instance. Only owners of dedicated instances can setup Log Analytics.
- Instance level role of Admin. Only instance administrators can create and configure Log Analytics services.
- An external system that will consume the streamed logs. Log Analytics currently supports the following external systems:
Creating a Log Analytics Service
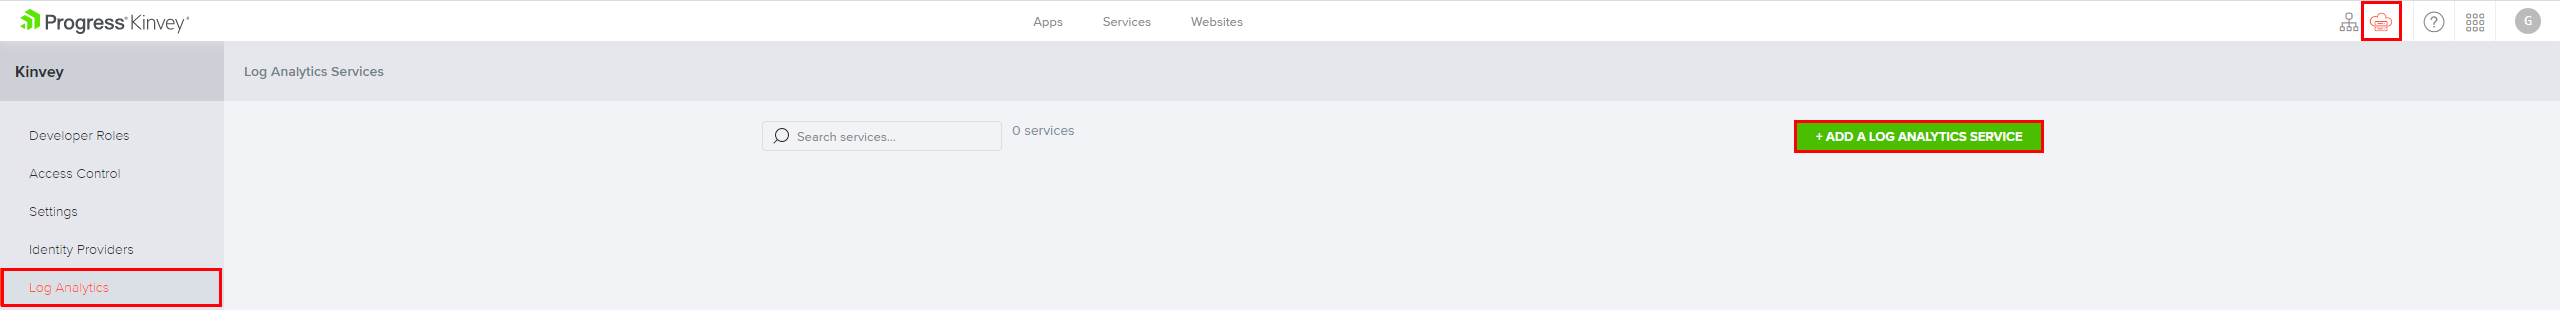
The four steps below explain how to access the Log Analytics creation form. The two paragraphs after that describe the information needed to configure the service.
- Navigate to your Kinvey Console instance and log in.
- Open the Instance Settings view by clicking on the respective icon in the top right corner.
- Select the Log Analytics tab from the left-side menu.
- Click on Add a Log Analytics service and select the type of service you want to create based on your external system.
The Log Analytics service creation form has several fields that are common between the different types of external systems:
| Field | Description | Required |
|---|---|---|
| Name | The name of the Log Analytics service as it will appear in the Instance Settings view | Yes |
| Description | This field can contain any additional information or comments about the Log Analytics service | No |
| Test Mode | Specifies if the service should produce a test event once every second | - |
There are additional service-specific fields that are different based on the external consumer system:
- Configuring service for Elasticsearch
- Configuring service for Splunk
- Configuring service for AWS S3
- Configuring service for Google Cloud Storage
- Configuring service for Azure Blob Storage
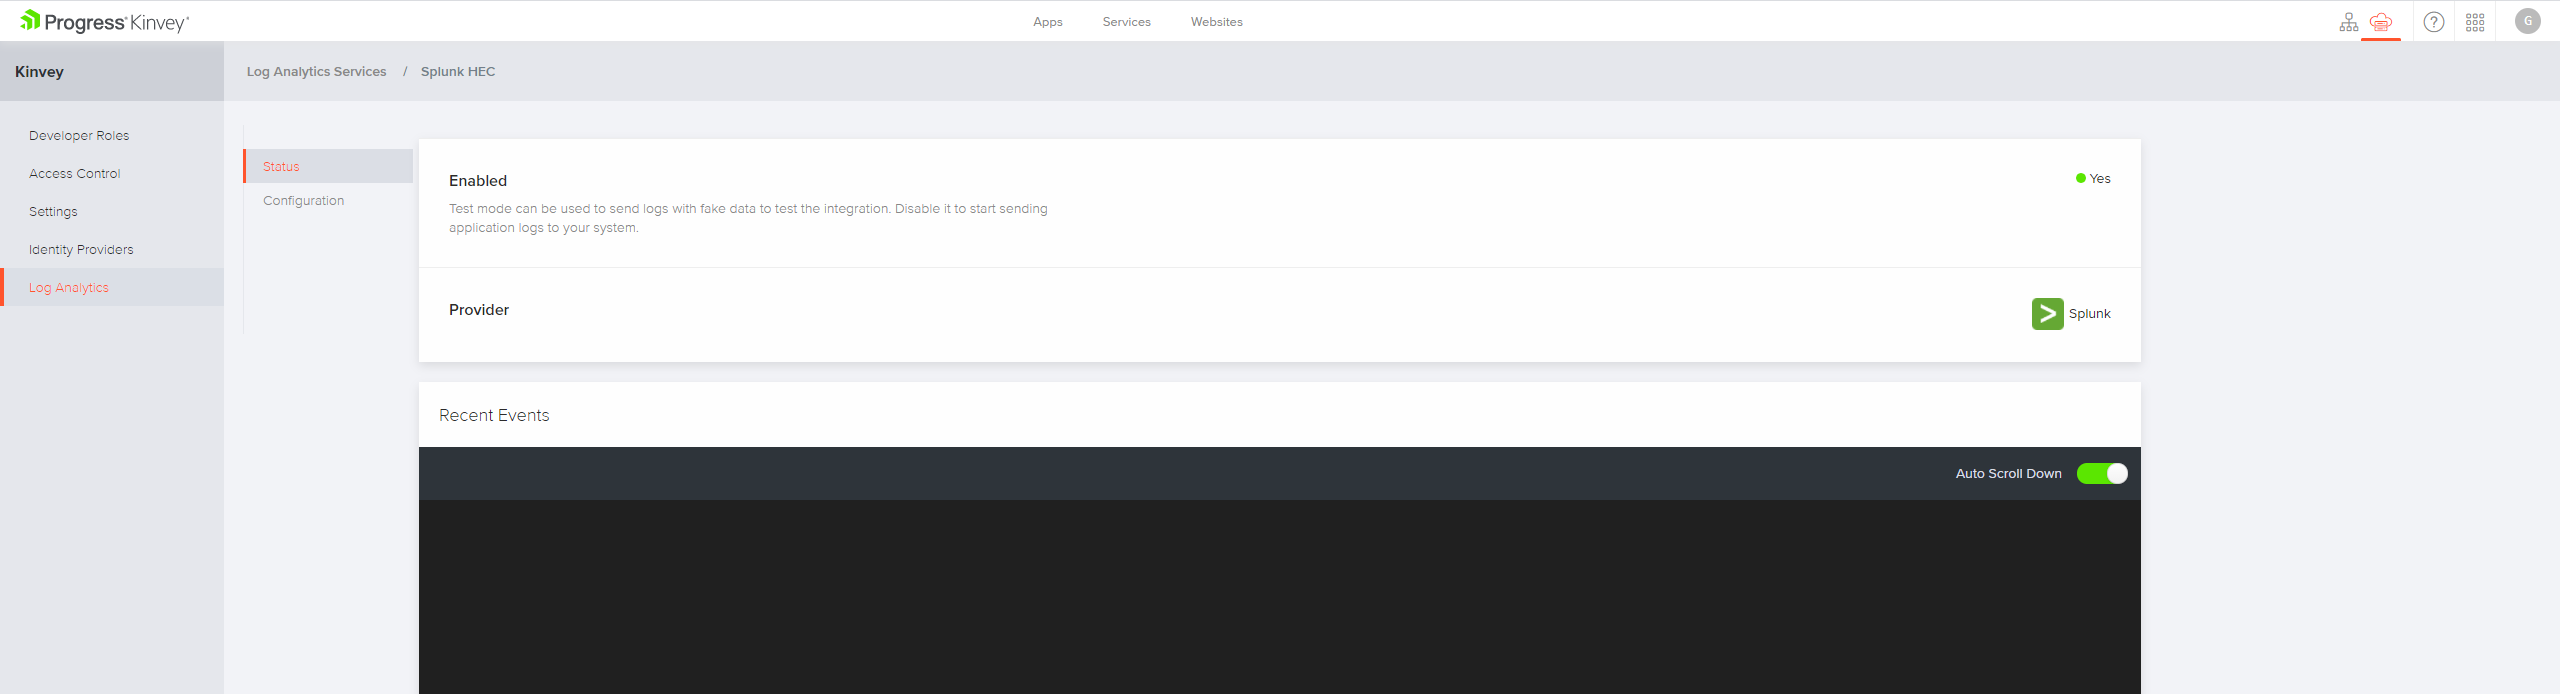
After you configure and save the service, you will be redirected to the Status Page of the service. The status page shows the type of service, whether it operates in test mode or not and a list of any recent warnings or error logged by the service. When you have verified that the events are received in the external system, you can disable the Test Mode.
Configuring service for Elasticsearch
| Field | Description | Required |
|---|---|---|
| Hosts | Specifies one or more Elasticsearch hosts (domain name and port) without the protocol. For example, customhost.com:9200,customhost2.com:9200,customhost2.com:9300/elastic_search | Yes |
| Index Name | Describes the Elasticsearch index in which the events are stored - for example, kinvey-%Y.%m.%d. It is recommended to specify a date pattern in the index name so that events are partitioned for faster searching for specific date range and easier deletion of old data. The default value will partition the data daily. Format parameters:
| Yes |
| User | Specifies the username for HTTP Basic authentication | No |
| Password | Specifies the password for HTTP Basic authentication | No |
| Certificate Authority | The CA certificate (PEM format) used for verifying a specific Elasticsearch host certificate | No |
| Client Certificate | The client certificate (PEM format) used when your Elasticsearch cluster wants to verify client connections | No |
| Client Key | The private key (PEM format) for the client | No |
| Client Key Password | Specifies the password for the client's private key, if any | No |
| SSL Verify | Specifies whether to verify the Elasticsearch's SSL certificate. This setting is enabled by default and we do not recommend disabling it in production | - |
| Protocol | The protocol to be used when calling the Hosts. HTTPS is selected by default. We do not recommend using HTTP in production | - |
Configuring service for Splunk
| Field | Description | Required |
|---|---|---|
| Host | The hostname/IP for the HTTP Event Collector (HEC) API token or the HEC load balancer without the protocol | Yes |
| Token | Specifies the authorization token for the HTTP Event Collector (HEC) API | Yes |
| Port | The port number for the HTTP Event Collector (HEC) | No |
| Certificate Authority | The CA certificate (PEM format) used for verifying a specific Splunk host certificate | No |
| Client Certificate | The client certificate (PEM format) used when your Splunk host wants to verify client connections | No |
| Client Key | The private key (PEM format) for the client | No |
| Insecure SSL | Specifies whether to skip verification of the Splunk host's SSL certificate. This setting is enabled by default and we do not recommend disabling it in production | - |
| Protocol | The protocol to be used when calling the Hosts. HTTPS is selected by default. We do not recommend using HTTP in production | - |
Configuring service for AWS S3
| Field | Description | Required |
|---|---|---|
| AWS S3 Bucket | The name of the Amazon S3 (Amazon Simple Storage Service) bucket to write logs to | Yes |
| AWS Access Key ID | Specifies the AWS access key id | Yes |
| AWS Secret Key | Specifies the AWS secret key | Yes |
| AWS S3 Region | The name of the Amazon S3 region | No |
| Path Prefix | Specifies the path where to store the files in the bucket | No |
| Store as | Specifies the format of the files containing the events. The default is gzip compressed which saves storage space and network traffic | - |
Configuring service for Google Cloud Storage
| Field | Description | Required |
|---|---|---|
| GCS Bucket | The name of the Google Cloud Storage bucket to write logs to | Yes |
| Google Cloud Credentials File | Contains credentials to access the GCS bucket. It is advisable to specify only the minimum required permissions, which are storage.buckets.get and storage.objects.create for this bucket. | Yes |
| Path Prefix | Specifies the path where to store the files in the bucket | No |
| Store as | Specifies the format of the files containing the events. The default is gzip compressed which saves storage space and network traffic | - |
Configuring service for Azure Blob Storage
| Field | Description | Required |
|---|---|---|
| Azure Storage Account Name | The name of the Storage account in the Azure Management portal | Yes |
| Azure Storage Access Key | The access key for the Storage account. Can be retrieved from the Azure Management portal | Yes |
| Azure Storage Container Name | Specifies the name of the Azure container, which will store the logs. A new one will be created if it does not exist | Yes |
| Path Prefix | Specifies the path in the Azure container where the log files will be stored | No |
| Azure Cloud | Specifies which Azure cloud will be used to store the logs. The default value is Azure Public Cloud. The other three options are Azure German Cloud, Azure China Cloud and Azure US Government Cloud | Yes |
Troubleshooting
Each Log Analytics service has a status page in which you can find information about the state of the service and the mode in which it operates at the moment. The Recent Events section on the status page will show any connection or configuration issues associated with the service and provide a way to identify and debug various problems.